
Complex and distributed detector readout and control systems are required to realize modern scientific experiments. The instrumentation integrates custom and commercial components from various sources and generates ever-increasing amounts of data. A variety of different formats, underlying storage engines, and data workflows is used. Often proper manual data interpretation and quality assurance is difficult or even impossible due to the tremendously increase of number, size and complexity of datasets. This raises the need for novel automatic or at least semi-automatic data analysis methods and tools. Information on operation status and scientific meaning needs to be extracted continuously from the data stream and provided to the users in a visual easy to interpret form.
Technology
We develop a range of services to handle slow control and data management tasks of mid-range scientific experiments. Our technologies aim to integrate the data recorded by various subsystems and make it available to users in a uniform, comprehensible, and easy-to-use fashion. The primary focus of our tools is simple time series data typical to slow control systems, but we also develop extensions to handle multi-dimensional time series, e.g. temperature maps, energy spectrum, etc.
The core of our platform RedHat OpenShift cluster based on containers and Kubernetes orchestration. The OpenShift infrastructure allows us to reliably run a large zoo of components developed by diverse international collaborations for a variety of experiments. These applications often depend on conflicting version of components, sometimes heavily outdated, and, unfortunately, not always entirely stable. The container technology allows us not only to isolate environment of each component, but also to limit impact that the bugs in one component might have on the others and overall system stability. The Kubernetes further provides high-availability and scalability. It automatically restarts failed components and migrates away components running on the failed nodes in the cluster. Number of running application replicas can be adjusted manually or automatically based on the current load.
To facilitate development of slow control and data management systems, we develop number of services which can be run on the Kubernetes platform or independent in standard Linux/Windows environment. Our main services are:
-
The EPICS-based slow-control system
-
OPC archiving appliance is a DOT.NET application which retrieves data from Siemens WinCC control system using OPC DA protocol and archives it in Microsoft SQL database
-
ADEI (Advanced Data Extraction Infrastructure) - is a scalable platform for explore, managing and visualizing large archives of time series data.
-
BORA (a personalized collaBORAtive data display) - a framework for generating applications that monitor the current status of the experiment
-
WAVe (Web-based Volume Visualization) - A 3D online visualization framework for large data archives
To provide slow control and data management services, we need to run a range of core IT services including distributed storage, databases, etc. Many of the required services are data intensive and their performance is impacted if run on OpenShift. We are currently researching the ways to run data-intensive applications in a cloud environment efficiently. The following particular topics are investigated:
-
Core IT Technologies
-
Distributed file systems for data intensive workloads (GlusterFS, CePH, BeeGFS)
-
Database technologies: relational (MSSQL, MySQL), document (MongoDB), time series (InfluxDB), image/matrices (TileDB)
-
-
Cloud Computing
-
Optimizing database workloads for the cloud environment
-
Run Windows applications in a cloud environment
-
-
Visualization
-
Image processing
-
Web-based data visualization with Spark, Jupyter and WebGL
-
We run a public OpenShift cluster for Katrin experiment which hosts all our services, but also allows KATRIN collaboration to run a variety of their applications. In future we look to extended it to other projects and provide scheduling mechanisms to ensure a fair share of resources for each of the experiment.
ADEI: Advanced Data Extraction Infrastructure
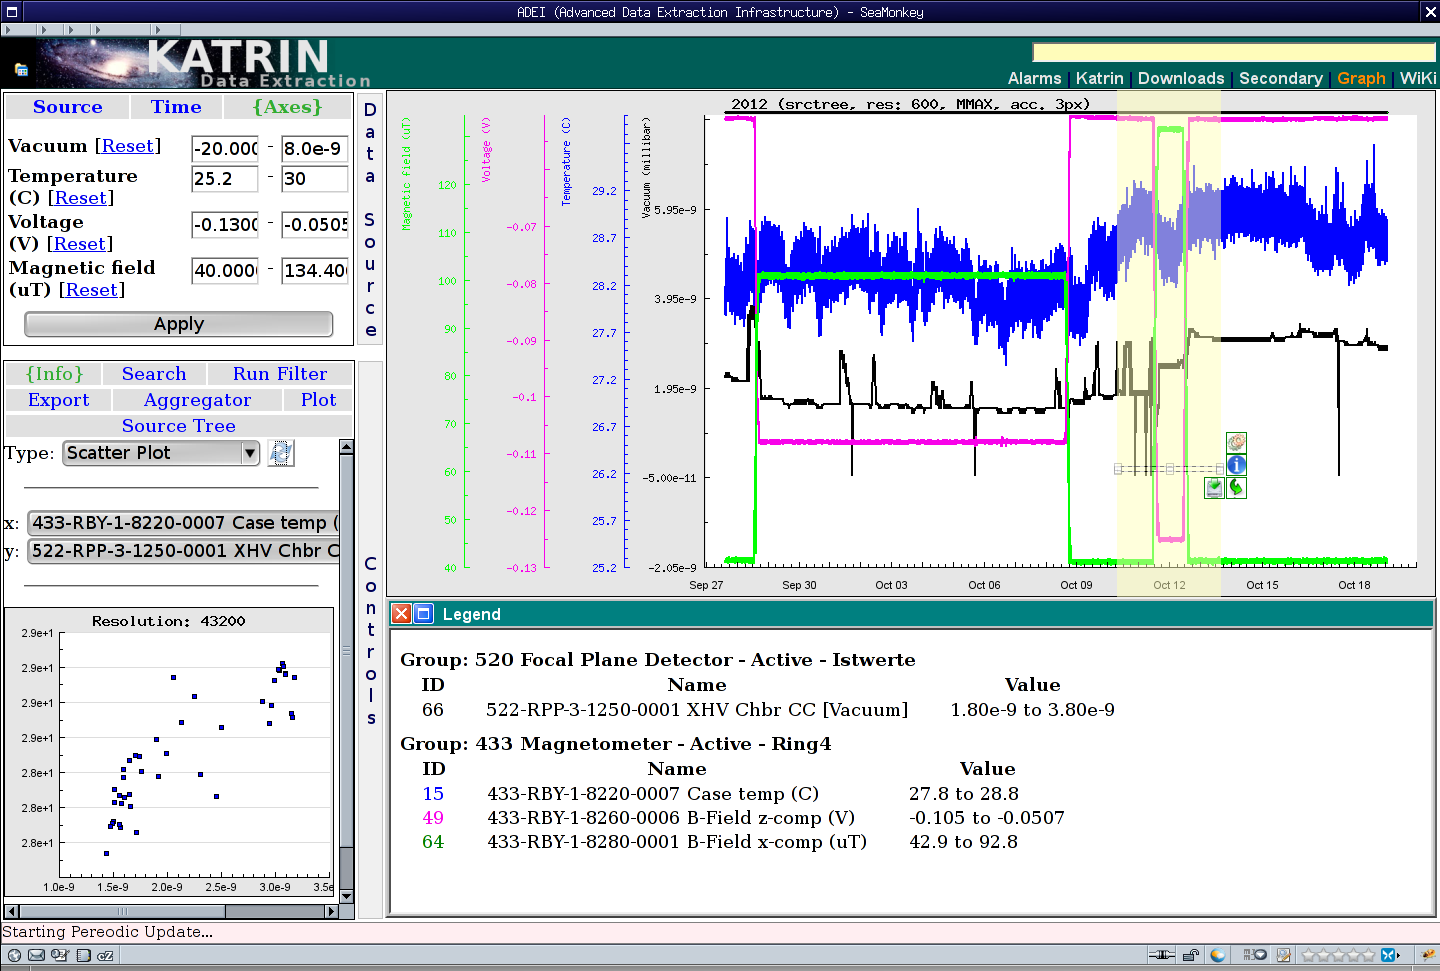
ADEI is a scalable platform to explore, manage, and visualize large archives of time series data. The main objective is to provide a single access point to all control data collected by the various subsystems of a large scientific experiment. ADEI includes a data abstraction layer allowing to integrate data written in different formats, stored in a variety of database engines, and recorded with varying sampling rates. RESTful API is used for integration with general data management system of the experiment. The filtering, search, visualization, and data analysis modules rely on developed caching strategies to provide interactive response also for very large archives. Depending on the expected data rate, ADEI can be either installed on a single server or deployed as multiple scalable components in RedHat's OpenShift cloud platform.
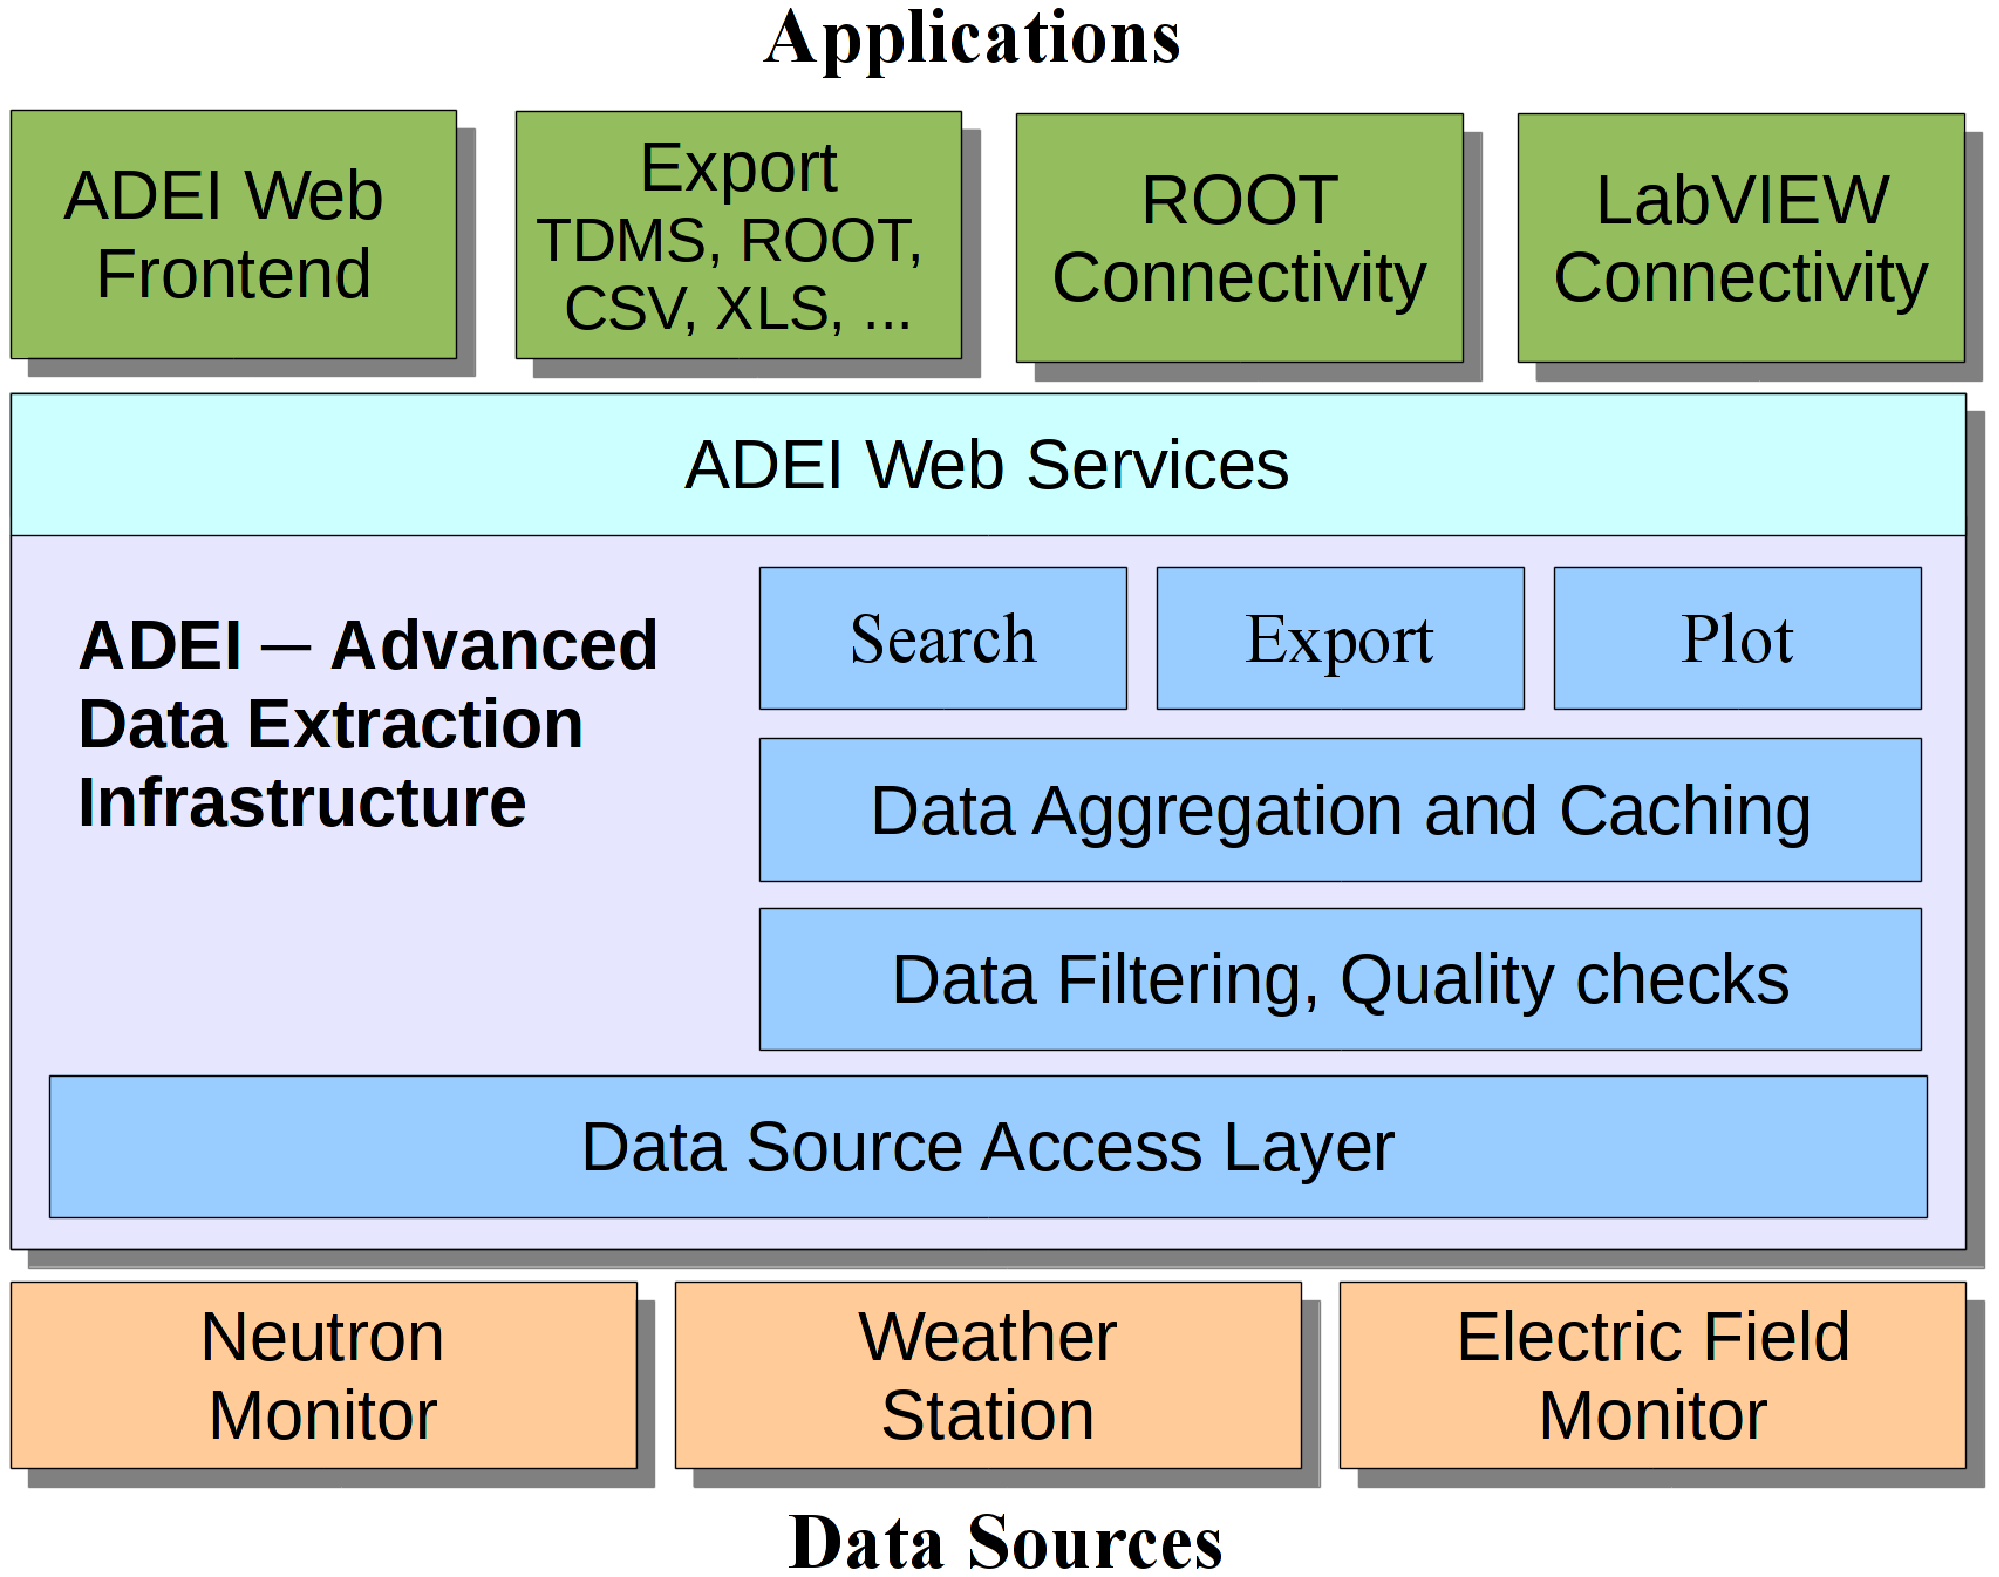
The ADEI web frontend is inspired by GoogleMaps interface. Single or multiple time series are plotted using the data from currently selected time interval. Then, the plot could be dragged and zoomed over time and value axes. The region of plot may be selected for detailed statistical analysis or exported in one of the supported formats. ADEI also integrates an WiKi engine and simple interface for statistical analysis. The WiKi provides a way to describe structure of the data and provides several specific extensions on top of standard WiKi syntax to automatically generate channel lists and data preview. A set of statistical modules is available for ADEI to extract extended information from the time series and provide basic insight in cross-correlations between different channels.
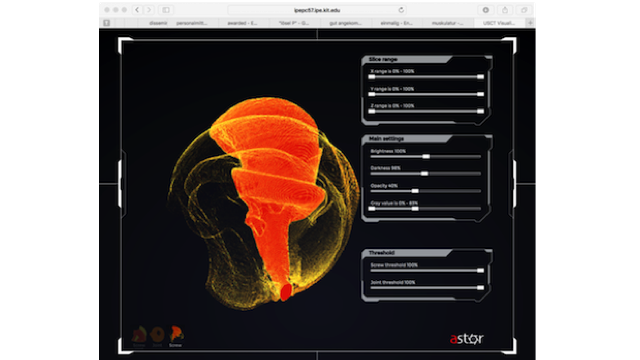
WAVe: Web-based volume visualization
With rapidly growing sizes of the scientific archives, there is a trend of keeping data at facilities and providing remote cloud-based services for data analysis. As part of the effort, we develop online data visualization platform which enables high quality preview of archived data. Combining client-side and server-side rendering and multi-level cache hierarchy we are able to provide interactive visualization without compromise in image quality. The developed framework supports volume and surface rendering modes and also enables zoom-on-demand approach, where a selected volumetric region is reloaded with higher details.
To provide robust visualization system we are developing a range of technologies:
-
Databases and efficient organization of 3D/4D imaging data
-
Standard image processing methods, e.g. background removal, noise reduction, etc.
-
Basic segmentation methods aimed to remove enclosures and containers around the objects
-
Image and video compression method
-
Remote 3D visualization with WebGL with special emphasis on adaptive quality, progressive loading and fast rendering methods
-
Analysis of user interaction with the aim of developing ML-based methods for system adaptation based on user behaviour and interests, e.g. adaptive image compression
Experiments & Projects
-
CATRIN
-
Edelweiss
-
Meteorological instruments (KIT Cube & Weather Tower)
-
Energy storage (BESS)
-
ASEC & SEVAN
-
TOSKA
-
ASTOR & NOVA
For students
We occasionally offer student topics across a variety of technologies used in our project. The topics range from database technology to cloud computing, image processing, and web-based visualization. The actual offerings are publish on IPE web site.